KPI functions
If you have created KPI mappings in the Exabel app, you can retrieve the proxy time series and the predictions from these mappings using DSL signals referring to the KPI mapping group. You can also retrieve predictions from the auto-models and custom models.
- kpi_proxy(kpi_group: int, *, forecast: bool = True, resample: bool = True)
Retrieve the proxy time series from a KPI mapping group.
The company can be used as the evaluation entity if there is only one mapping for that company within the given KPI mapping group. If there are several FactSet segments or Visible Alpha line items that have been mapped for the company, then the KPI must be specified by using the segment or the line item as the evaluation entity.
Every night, the Exabel system calculates the forecasted and resampled version of the proxy time series as part of updating the KPI mapping results. This time series is then persisted. When this DSL signal is used with
forecast=Trueandresample=True(the default), it is this persisted version of the proxy which is retrieved, whereas if eitherforecastorresampleis set toFalse, the underlying proxy signal is evaluated on the fly (and optionally either forecasted or resampled).- Parameters:
kpi_group (int) – the id of the KPI mapping group
forecast (bool) – whether to forecast the proxy time series
resample (bool) – whether to resample the proxy time series to the fiscal calendar of the KPI
Examples:
Get the forecasted and resampled version of a proxy time series from the KPI mapping group with numeric ID 123:
kpi_proxy(123)
Get the forecasted proxy time series, without resampling:
kpi_proxy(123, resample=False)
Get the raw proxy time series, without forecasting or resampling:
kpi_proxy(123, forecast=False, resample=False)
- kpi_predictions(*, kpi_group: int, model: int, kpi: str, kpi_value: str | int, freq: str, series: str, run: int, relative_days: int)
Retrieve the KPI predictions from a model.
The source of the predictions can be specified in one of three manners:
For each KPI mapping, there is a model which produces predictions for the KPI, which only uses the proxy time series as input. To retrieve these predictions, specify the KPI mapping group with the
kpi_groupargument.For custom models, the predictions can be retrieved by specifying the
modelargument. For these models, when retrieving backtests, the run number can also be specified with therunargument.For Exabel models, the predictions can be retrieved by specifying the
kpialong with akpi_value. For these models, you can also specify afreq, since there may be multiple Exabel models with different frequencies.
The company must be used as the evaluation entity. The signal only works if there is exactly one KPI result belonging to the given company.
- Parameters:
kpi_group (int) – The id of the KPI mapping group
model (int) – The id of the prediction model
kpi (str) – The KPI type. Either
'fs'(FactSet) or'va'(Visible Alpha).kpi_value (str/int) – The KPI line item. If
kpiis'fs', this must be a string. Ifkpiis'va', it can be a string or an integer.freq (str) – Optionally, the frequency of the Exabel model. If provided, the Exabel model with that frequency is used, if it exists. If no frequency is provided, one of the available Exabel models is used, if any. If there are multiple Exabel models, the one with the company’s reporting frequency is used if it exists, and otherwise the Exabel model with a sub-annual frequency is preferred to the one with annual frequency.
series (str) – Either
'backtests','predictions'or'combined'. Defaults to'combined', which combines the backtests and the live predictions into one time series.run (int) – The run number to retrieve backtests from. Can only be used with the
modelargument, and withseriesbeing either'backtests'or'combined'.relative_days (int) – Optionally, the number of days the “known time” is relative to the date of the data point. For example, with
relative_days=7, for each data point you will get the prediction as they were calculated one week after the end of each fiscal period. A negative value will give you known times prior to the end of the fiscal periods.
Examples:
Get the combined predictions from the KPI mapping group with numeric ID 123:
kpi_predictions(kpi_group=123)
Get the combined predictions from the model with numeric ID 123:
kpi_predictions(model=123)
Get the live predictions (without backtests) from the model with numeric ID 123:
kpi_predictions(model=123, series="predictions")
Get the backtests from the model with numeric ID 123:
kpi_predictions(model=123, series="backtests")
Get the predictions of the Exabel model for FactSet sales:
kpi_predictions(kpi='fs', kpi_value='SALES')
Get the predictions of the Exabel model for Visible Alpha total revenue:
kpi_predictions(kpi='va', kpi_value=190)
- kpi_model_revisions(*, kpi_group: int, model: int, kpi: str, kpi_value: str | int, freq: str, period: str, series: str, values: str | list[str], interval_width: float = 0.95, error_metric: str, num_periods: int = 8, min_periods: int = 4, relative_to: str = 'end')
Retrieve the revisions of KPI predictions for a given fiscal period.
The source of the revisions can be specified in one of three manners:
For each KPI mapping, there is a model which produces predictions for the KPI, which only uses the proxy time series as input. To retrieve the revisions for these predictions, specify the KPI mapping group with the
kpi_groupargument.For custom models, the revisions can be retrieved by specifying the
modelargument.For Exabel models, the revisions can be retrieved by specifying the
kpialong with akpi_value. For these models, you can also specify afreq, since there may be multiple Exabel models with different frequencies.
The company must be used as the evaluation entity. The signal only works if there is exactly one KPI result belonging to the given company.
- Parameters:
kpi_group (int) – the id of the KPI mapping group
model (int) – the id of the prediction model
period (str) – a fiscal period, for example,
1Q-2025,FQ1orRQ1, or by specifying the last date in the period, for example2025-03-31.kpi (str) – The KPI type. Either
'fs'(FactSet) or'va'(Visible Alpha).kpi_value (str/int) – The KPI line item. If
kpiis'fs', this must be a string. Ifkpiis'va', it can be a string or an integer.freq (str) – Optionally, the frequency of the Exabel model. If provided, the Exabel model with that frequency is used, if it exists. If no frequency is provided, one of the available Exabel models is used, if any. If there are multiple Exabel models, the one with the company’s reporting frequency is used if it exists, and otherwise the Exabel model with a sub-annual frequency is preferred to the one with annual frequency.
series (str) – the kind of time series to return; the options are
'predictions','backtests'and'combined'. In the case of'combined', predictions are retrieved first, and if they are not present, the backtests are retrieved. The default is'combined'.values (str/list[str]) – The time series to return. A string or list of strings chosen from
'prediction'(the predicted values),'lower'(the lower confidence band),'upper'(the upper confidence band), and'errors'(the historical errors). The default is'prediction', but if theinterval_widthargument is provided, the default is['prediction', 'lower', 'upper']. Error-related values ('lower','upper','errors') are only available when usingmodelorkpi/kpi_valueto specify the prediction source, not when usingkpi_group.interval_width (float) – The width of the confidence interval used for
'lower'and'upper'bands. Must be between 0 and 1. The default value is0.95.error_metric (str) – How errors are calculated. Either
'MAPE'(mean absolute percentage error) or'MAE'(mean absolute error). If not provided, the metric is auto-detected based on the units of the actual values: ratio/percentage units use MAE, all other units use MAPE.num_periods (int) – The number of past fiscal periods used to calculate the historical error. The default value is
8.min_periods (int) – The minimum number of past periods with data required for error calculation. If fewer periods have data, the error is NaN. The default value is
4.relative_to (str) – The reference point for aligning historical revision dates when computing error rates and confidence bands. Either
'end'(the last date of the fiscal period) or'publish'(publication date). The default value is'end'.
Examples:
Get the revisions for the prediction of the 2023-09-30 KPI value from the KPI mapping group with numeric ID 123:
kpi_model_revisions(kpi_group=123, period="2023-09-30")
Get the revisions for the prediction of the 3Q-2021 KPI value from the model with numeric ID 123:
kpi_model_revisions(model=123, period="3Q-2021")
Get revisions with 95% confidence bands for the Exabel FactSet sales model:
kpi_model_revisions(kpi='fs', kpi_value='SALES', period='1Q-2025', values=('prediction', 'lower', 'upper'))
Historical error rates for Visible Alpha total revenue model predictions:
kpi_model_revisions(kpi='va', kpi_value=190, period='1Q-2025', values='errors')
Confidence bands for FactSet sales model revisions, with errors aligned relative to publication date:
kpi_model_revisions(kpi='fs', kpi_value='SALES', period='1Q-2025', values=('prediction', 'lower', 'upper'), relative_to='publish')
- kpi_impact(kpi, kpi_value, freq='FQ', impact_days=1, window=None, alignment='end', min_periods=10)
Calculate the KPI impact of a given KPI.
KPI impact is defined as the correlation between the KPI surprise (actual beat/miss vs consensus) and share price reaction. The signal produces a time series with 1 data point per fiscal period, with each data point showing the correlations up till that period, either on an expanding or rolling window basis.
- Parameters:
kpi (str) – The KPI type. Either
'fs'(FactSet estimates) or'va'(Visible Alpha).kpi_value (str/int) – A FactSet estimates data item or a Visible Alpha line item.
freq (str) – A fiscal frequency:
'FQ/FS','FQ','FS'or'FY'.impact_days (int) – The number of days to look forward from the reported date to calculate the relative change in close price. E.g. with impact_days=1, the change in close price is calculated from the day before the report date to the report date. If the report date is a non-trading day, the change is calculated from the next possible trading day.
window (int) – Optionally, a rolling window size to use for the correlation. If not specified, an expanding window is used. Must be larger than
min_periods.alignment (str) – An alignment:
'end','month-end','publish'or'report'.min_periods (int) – The minimum number of periods required for the correlation calculation.
Mathematically, the KPI impact is calculated using the following equations:
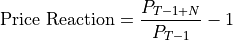
where
 equals close price for the share,
  is the impact days, and
  is
the report date.
is
the report date.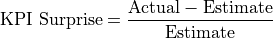
When calculating the correlation, we clip the price reaction (-0.1, 0.1) and the KPI surprise (-0.2, 0.2) to reduce the influence of outliers and improve the robustness of the correlation.

Examples:
Calculate the KPI impact for Visible Alpha Total revenue (190):
kpi_impact(kpi='va', kpi_value=190)
Calculate the KPI impact on an 8-quarter rolling basis (assuming that the KPI is reported quarterly):
kpi_impact(kpi='fs', kpi_value='SALES', window=8)
Calculate the KPI impact for Visible Alpha Total operating expenses (195), looking at the share price reaction for each period from report date to 5 days post-report date:
kpi_impact(kpi='va', kpi_value=195, impact_days=5)