Graph traversal and filtering
On the
page on Exabel Data API signals, we describe how data can be fetched
using the data(...) and graph_signal(...) constructs. In this page we’ll describe a new,
simpler way of fetching data from the graph.
Graph traversal
A common operation is to fetch data for all entities connected to the evaluation entity. One can then
use the signal.for_type(entity_type) construct. We will then fetch data for all entities of the
given type, which are connected to the evaluation entity. We follow the shortest path(s) in the
combined data model of the evaluation entity namespace, the target entity type namespace and the
global namespace.
- signal.for_type(entity_type, ...)
Retrieve data for a specific entity type.
- Parameters:
entity_type – the entity type to fetch the signal for, on the form
namespace.entity_type.
Note that although it’s usually enough to specify a single entity type, it is possible to pass
multiple entity types to the .for_type(..) method. We then follow a path through all the
specified entity types in the data model, and the final entity type would be the entity type for
which the underlying signal would be evaluated.
Doing:
data('ns.metric').for_type('ns.brand', 'ns.product')
would be equivalent to doing:
data('ns.metric').for_type('ns.product').for_type('ns.brand')
Examples
Retrieve the time series for signals/namespace.brand_metric for all the brands connected to the evaluation entities:
data('namespace.brand_metric').for_type('namespace.brand')
Sum all the time series for the products sold by the evaluation entity:
data('namespace.products_sold').for_type('namespace.product').sum()
Graph filtering
Sometimes one is not interested in all the connected entities of the specific type, but only a subset. We therefore support filtering the entities for which we fetch data down to only those entities connected to some other set of entities.
A use case could be to fetch sales data for only those products which are sold in the “Clothing” category.
- signal.graph_filter(entity_type, entities)
Retrieve data for a specific entity type.
- Parameters:
entity_type – the entity type to filter by, on the form
namespace.entity_type.entities – the entities to filter by, either as a single entity
namespace.entityor as a list['namespace.entity1', 'namespace.entity2'].
Examples
Retrieve all the data for products sold in the “Clothes” category:
data('ns.products_sold').for_type('ns.product').graph_filter('ns.category', 'ns.clothes')
Retrieve all the transactions in stores in a set of countries:
data('ns.transactions').for_type('ns.company_country').graph_filter('ns.country', ['ns.no', 'ns.se'])
Advanced filtering
In some cases, when performing the signal.graph_filter(..) operation, one can leave out the
signal.for_type(..) traversal. We will then attempt to identify an associative entity type between
the evaluation entity type and the filtered entity type.
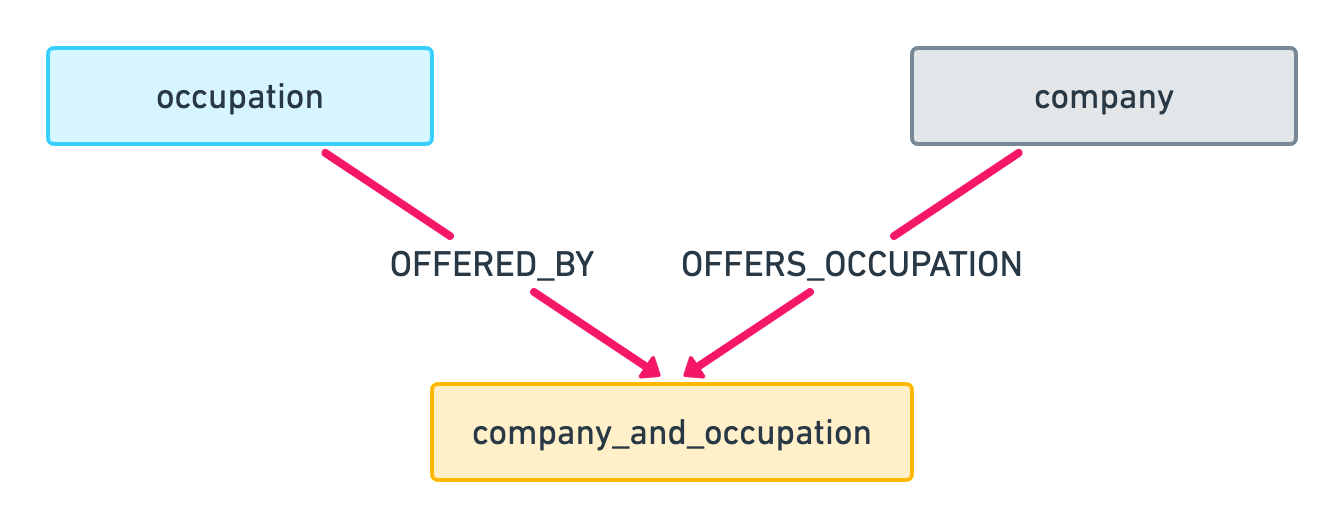
In the example above, it would be sufficient to evaluate the following signal for a company to get the time series for the “Teacher” occupation:
data('ns.jobs').graph_filter('ns.occupation', 'ns.teacher')
The user has then asked about data for the evaluation company, and the “Teacher” occupation, and we
infer that we must fetch the data from the associative ns.company_and_occupation entity type.
If the associative entity is a combination of multiple entity types, one can also apply multiple filters:
data('ns.transactions').for_type('ns.category_country_channel').graph_filter('ns.category', 'ns.shoes').graph_filter('ns.channel', 'ns.online')
Grouping
Aggregation through grouping works similar to the existing .group_by_entity(..) function except
that one must provide an entity type instead of a path. We then identify and follow the shortest
path(s) in the data model to find the entities that we want to group by.
- signal.graph_group_by(entity_type, operation)
Group and aggregate the time series by a specific entity type.
- Parameters:
entity_type – the entity type to group by, on the form
namespace.entity_type.operation – the aggregation operation, either
"sum"or"mean".
Examples
Get the sales of products, summed by category:
data('ns.products_sold').for_type('ns.product').graph_group_by('ns.category', 'sum')